Analysis and Visualization
So far we’ve only talked about audio synthesis and processing, but that is only half of the functionality that the Web Audio API provides. The other half, audio analysis, is all about understanding what the sound that is being played is like. The canonical example of this feature is visualization, but there are many other applications far outside the scope of this book, including pitch detection, rhythm detection, and speech recognition.
This is an important topic for us as game developers and interactive application builders for a couple of reasons. Firstly, a good visual analyzer can act as a sort of debugging tool (obviously in addition to your ears and a good metering setup) for tweaking sounds to be just right. Secondly, visualization is critical for any games and applications related to music, from games like Guitar Hero to software like GarageBand.
Frequency Analysis
The main way of doing sound analysis with the Web Audio API is to
use AnalyserNodes. These nodes do not change the sound in any
way, and can be placed anywhere in your audio context. Once this node is
in your graph, it provides two main ways for you to inspect the sound
wave: over the time domain and over the frequency domain.
The results you get are based on FFT analysis over a certain buffer size. We have a few knobs to customize the output of the node:
fftSizeThis defines the buffer size that is used to perform the analysis. It must be a power of two. Higher values will result in more fine-grained analysis of the signal, at the cost of some performance loss.
frequencyBinCountThis is a read-only property, set automatically as
fftSize/2.smoothingTimeConstantThis is a value between zero and one. A value of one causes a large moving average window and smoothed results. A value of zero means no moving average, and quickly fluctuating results.
The basic setup is to insert the analyzer node into the interesting part of our audio graph:
// Assume that node A is ordinarily connected to B.varanalyser=context.createAnalyser();A.connect(analyser);analyser.connect(B);
Then we can get frequency or time domain arrays as follows:
varfreqDomain=newFloat32Array(analyser.frequencyBinCount);analyser.getFloatFrequencyData(freqDomain);
In the previous example, freqDomain is an array of 32-bit floats
corresponding to the frequency domain. These values are normalized to be
between zero and one. The indexes of the output can be mapped linearly
between zero and the nyquist frequency, which is
defined to be half of the sampling rate (available in the Web Audio API
via context.sampleRate). The following snippet maps from
frequency to the correct bucket in the array of frequencies:
functiongetFrequencyValue(frequency){varnyquist=context.sampleRate/2;varindex=Math.round(frequency/nyquist*freqDomain.length);returnfreqDomain[index];}
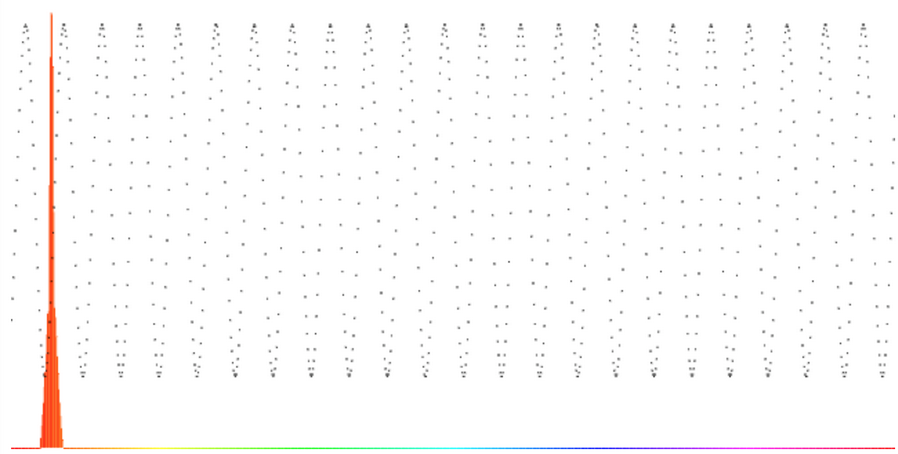
If we are analyzing a 1,000-Hz sine wave, for example, we would
expect that getFrequencyValue(1000)
would return a peak value in the graph, as shown in Figure 5-1.
The frequency domain is also available in 8-bit unsigned units via
the getByteFrequencyData call. The values of these integers
is scaled to fit between minDecibels and
maxDecibels (in dBFS) properties on the analyzer node, so
these parameters can be tweaked to scale the output as desired.
Animating with requestAnimationFrame
If we want to build a visualization for our soundform, we need to
periodically query the analyzer, process the results, and render them. We
can do this by setting up a JavaScript timer like setInterval
or setTimeout, but there’s a better way:
requestAnimationFrame. This API lets the browser incorporate
your custom draw function into its native rendering loop, which is a great
performance improvement. Instead of forcing it to draw at specific
intervals and contending with the rest of the things a browser does, you
just request it to be placed in the queue, and the browser will get to it
as quickly as it can.
Because the requestAnimationFrame API is still
experimental, we need to use the prefixed version depending on user agent,
and fall back to a rough equivalent: setTimeout. The code for
this is as follows:
window.requestAnimationFrame=(function(){returnwindow.requestAnimationFrame||window.webkitRequestAnimationFrame||window.mozRequestAnimationFrame||window.oRequestAnimationFrame||window.msRequestAnimationFrame||function(callback){window.setTimeout(callback,1000/60);};})();
Once we have this requestAnimationFrame function defined, we
should use it to query the analyzer node to give us detailed information
about the state of the audio stream.
Visualizing Sound
Putting it all together, we can set up a render loop that queries
and renders the analyzer for its current frequency analysis as before,
into a freqDomain array:
varfreqDomain=newUint8Array(analyser.frequencyBinCount);analyser.getByteFrequencyData(freqDomain);for(vari=0;i<analyser.frequencyBinCount;i++){varvalue=freqDomain[i];varpercent=value/256;varheight=HEIGHT*percent;varoffset=HEIGHT-height-1;varbarWidth=WIDTH/analyser.frequencyBinCount;varhue=i/analyser.frequencyBinCount*360;drawContext.fillStyle='hsl('+hue+', 100%, 50%)';drawContext.fillRect(i*barWidth,offset,barWidth,height);}
We can do a similar thing for the time-domain data as well:
vartimeDomain=newUint8Array(analyser.frequencyBinCount);analyser.getByteTimeDomainData(freqDomain);for(vari=0;i<analyser.frequencyBinCount;i++){varvalue=timeDomain[i];varpercent=value/256;varheight=HEIGHT*percent;varoffset=HEIGHT-height-1;varbarWidth=WIDTH/analyser.frequencyBinCount;drawContext.fillStyle='black';drawContext.fillRect(i*barWidth,offset,1,1);}
This code plots time-domain values using HTML5 canvas, creating a simple visualizer that renders a graph of the waveform on top of the colorful bar graph, which represents frequency-domain data. The result is a canvas output that looks like Figure 5-2, and changes with time.
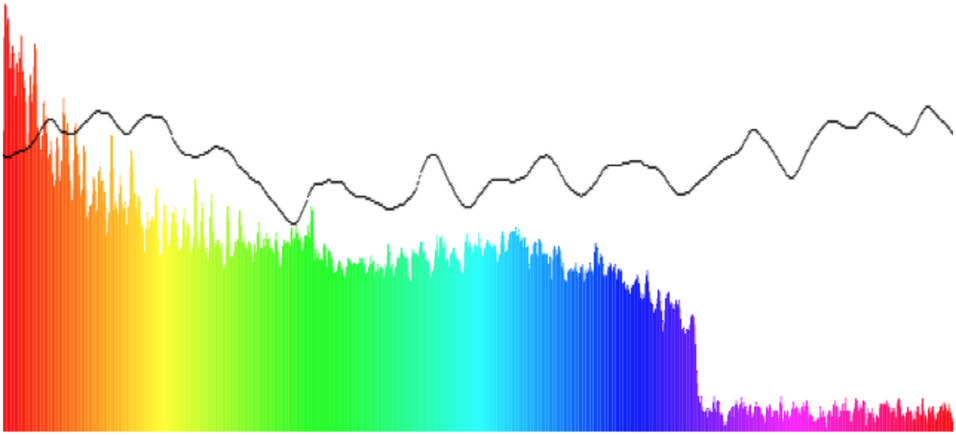
{{jsbin width="100%" height="800px" src="http://orm-other.s3.amazonaws.com/webaudioapi/samples/visualizer/index.html"}}
Our approach to visualization misses a lot of data. For music visualization purposes, that’s fine. If, however, we want to perform a comprehensive analysis of the whole audio buffer, we should look to other methods.